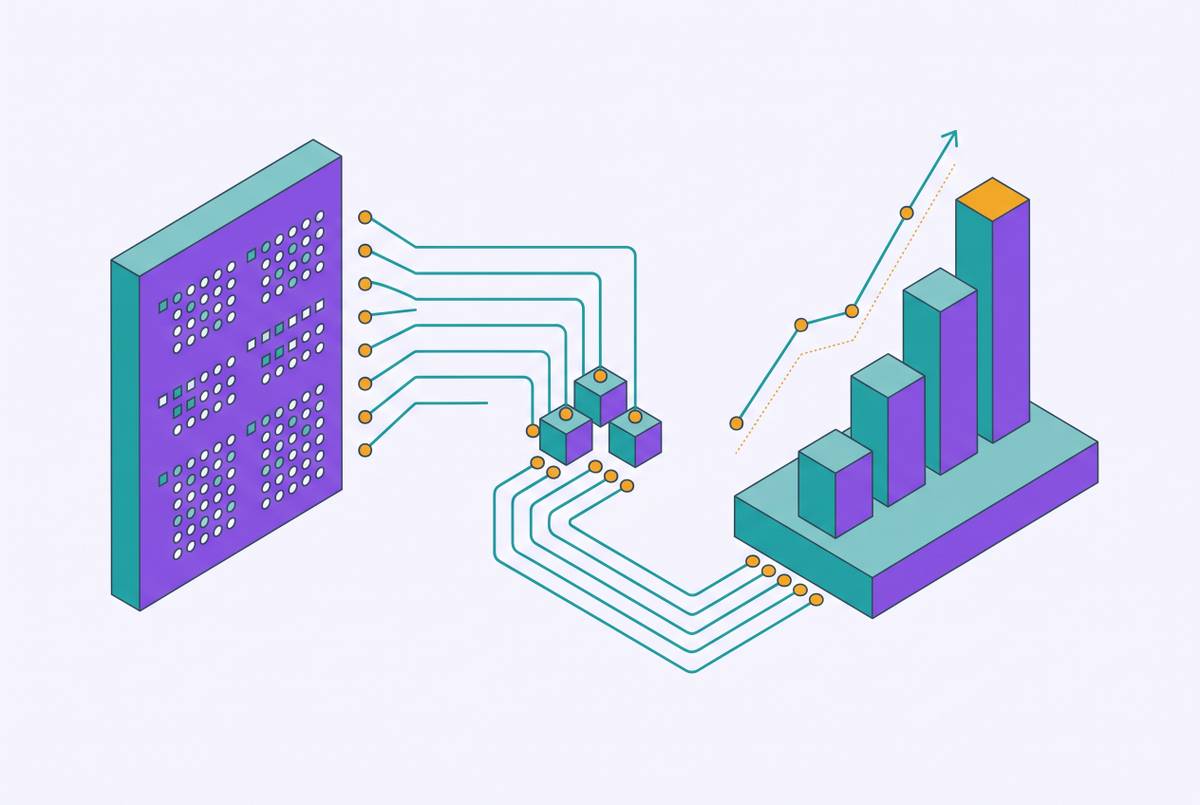
Topic Accuracy Rates and SAT Section Score Forecasting
Topic accuracy by cluster predicts your Digital SAT score better than overall practice test results.
This article is about why topic-level accuracy, not overall practice score, is the number that actually predicts a student's Digital SAT section score. The reason comes down to how the test itself is built: because the Digital SAT routes students into an easier or harder second module based on first-module performance, the questions a student gets right or wrong in Module 1 don't just add up to a score. They decide which test the student takes next.
The Digital SAT's Adaptive Architecture and Topic-Level Accuracy
The Digital SAT doesn't hand every student the same set of questions. It uses what's called multistage adaptive testing, or MST, in which Module 1 performance sets whether Module 2 is easier or harder. Students who clear a certain accuracy bar on Module 1 get routed to the harder Module 2. Students who don't, get the easier version, and the easier version caps out around 570 to 600 per section. That ceiling is a hard limit built into the test's architecture, and no amount of strong performance on the easy Module 2 can push a student past it.
That routing threshold is an accuracy cutoff applied to Module 1 performance, calculated before a student ever sees Module 2, not a published scaled score. So the real decision point for a student's entire section score happens early, and it happens based on how well they handled specific types of questions, not how many points they racked up overall. A student can answer plenty of questions correctly in Module 1 and still miss the routing threshold if those correct answers happened to land in the wrong clusters.
That's what makes topic-level accuracy the variable that controls everything downstream. A score forecast that ignores topic breakdown is ignoring the actual mechanism that produces the final number. The forecast has to track performance by cluster because the test itself scores by cluster, at least in terms of what determines routing. Everything else, including how "practice" should be defined for a student preparing for this test, builds from that fact.
Why Aggregate Practice Scores Mislead Students
Here's where the trouble starts for most students: they track one number. A practice test comes back with a score, the score feels encouraging or discouraging, and the student moves on without ever looking at how that score was built. But a single aggregate score can hide a routing-level problem completely.
Picture two students who both miss 12 questions on a practice Module 1. One of them misses questions scattered across a dozen different topics, a point here, a point there, nothing concentrated. The other concentrates most of those misses in a single high-weight cluster, say a specific algebra topic that appears constantly. Both students might report nearly identical raw scores. But the first student may clear the routing threshold easily, while the second student, whose errors cluster tightly in one weak spot, may get routed to the easier Module 2 and get locked into that 570 to 600 ceiling. Same score on paper. Very different outcomes on test day.
The problem compounds further because Module 1 doesn't weight every question the same way. Harder questions carry more consequence for routing than easier ones, so a student who misses two hard questions in a weak cluster is in worse shape than a student who misses two easy questions somewhere else, even though both show up identically in an aggregate count. Errors aren't interchangeable, and treating them that way is exactly where aggregate scoring falls apart.
The same miscalibration problem appears in how students pick their practice material. Not every official Bluebook practice test predicts a real score with the same accuracy. Tests 8 and 9, specifically, have Math sections that run easier than what most students will actually face on test day. A student who trains heavily on those two forms will walk away with an inflated sense of where they stand, because the practice material itself is softer than the real exam.
Together, these two problems make the forecasting failure two-layered. Students are measuring the wrong thing (aggregate score instead of topic cluster) using the wrong material (miscalibrated practice tests). Either mistake alone would distort a forecast. Together, they can leave a student walking into test day with a number in their head that has little connection to what they're about to experience.
What topic-level accuracy data reveals that raw scores cannot
A raw score answers one question: how many did the student miss. That's useful, but it's thin. Topic-level accuracy answers three questions at once: which clusters the student missed, how consistently they missed them, and at what difficulty level those misses happened. Those three variables determine module routing and score ceiling, so a credible forecast needs to work with them.
Think about what that data actually exposes. A student scoring well on accuracy across the board looks fine in aggregate. But topic-level data might show that aggregate number breaks down into strong accuracy on most clusters and much weaker accuracy on one. That weaker cluster is the one quietly capping the student's score, and no amount of strength in the other clusters will fix it, because the test doesn't average cluster performance into a single smooth curve. It routes based on whether specific accuracy thresholds get cleared.
Consistency matters here as much as raw accuracy. A student who gets a topic right three times out of five, inconsistently, is a different case than a student who gets it right zero out of five or five out of five. Inconsistent performance at medium difficulty signals a shaky foundation, the kind of gap that might not appear reliably in any single practice test but will recur repeatedly across a real exam's worth of similarly structured questions.
Research into how conversational AI tools detect knowledge gaps points toward where this kind of diagnosis is heading. Instead of only looking at whether a student answered correctly, researchers are studying what the pattern of a student's questions reveals about what they don't understand, without needing a separate formal assessment to surface it. That's a different, more detailed layer of signal than accuracy alone, and it suggests topic-level data is going to get sharper, not just more common, as prep tools develop. For now, though, even accuracy broken out by cluster and difficulty level already gives students something raw scores never could: a map of exactly where their preparation needs to go next.
Translating Topic Accuracy into Score Forecasts
Knowing which clusters are weak is only useful if that information turns into something concrete, like a projected score range or a routing probability. That translation is where AI-powered prep systems earn their keep, and it depends on more than just totaling up right and wrong answers.
A credible forecast needs accuracy rate broken out per topic cluster rather than averaged across the whole test, because an overall percentage hides exactly the kind of concentrated weakness that determines routing. It also needs to account for the difficulty level of each question at the moment a student attempts it, since an error on a hard question carries different weight than an error on an easy one, and a forecast that treats them the same will misjudge the student's actual position. Time spent per question matters too: a student who gets a question right after a long pause is showing a different kind of readiness than a student who answers quickly and correctly, and that distinction separates genuine fluency from a lucky guess or a slow grind to the right answer.
Those three inputs give a system enough to simulate the test's own decision process. Rather than just converting a raw number of correct answers into a scaled score, a system built this way can estimate the probability a student clears the Module 1 threshold and reaches the harder Module 2, along with the expected score range under each routing outcome. That's a meaningfully different exercise than a basic score calculator that maps practice-test results onto a projected score without ever touching the question of which module a student is likely to see. The calculator approach treats the test as a single flat scale. The simulation approach treats it as the two-stage, threshold-driven system it actually is.
One example of this more detailed approach comes from a prep platform built around identifying where a student's thinking actually breaks down. Instead of stopping at an accuracy count, the system works to pinpoint the specific conceptual gap standing between a student and a better routing outcome, producing a forecast grounded in understanding. That distinction, between counting errors and locating their cause, is what separates a surface-level forecast from one that can actually point to what to fix.
The reliability ceiling on AI score forecasting
None of this works, though, if the practice material behind it doesn't match the real exam. A topic-accuracy forecast can be built with careful logic and still overpredict a student's score, systematically and confidently, if the questions feeding it are softer than what the student will face on test day. That's the deepest structural risk in this entire approach.
The issue isn't with the forecasting logic itself. The math behind estimating routing probability and expected score range can be sound and still produce a number that drifts from reality, because the problem lives upstream, in the question bank the model trains and tests on. An AI model fed inflated or unrepresentative practice questions will produce predictions that look precise and feel trustworthy, while quietly missing the mark. The sophistication of the algorithm doesn't fix a bad input. How closely a question bank mirrors the real exam's difficulty distribution and topic weighting sets a ceiling on forecast accuracy that no amount of clever modeling can push past.
A related limit appears in how AI grades writing. Practice essay feedback from an AI system can be accurate enough to guide a student's revisions and still fall short of matching the judgment applied to real, officially scored AP and SAT writing tasks. Students using that feedback should understand what standard it's actually calibrated to, since practice-level accuracy and exam-level scoring judgment aren't guaranteed to be the same thing.
A broader caution applies alongside both of these points. Research into frontier AI systems and scientific forecasting found that strong reasoning performance on known problems doesn't reliably translate into accurate forecasting of future outcomes. Being good at evaluating what's already true is a different skill from predicting what comes next, and the second skill can fail even when the first one is sharp. The same gap can occur in SAT score forecasting: a model that correctly scores a student's past performance isn't automatically good at projecting forward to test day. None of this means topic-accuracy forecasting is a broken idea. It means the reliability of any forecast is only as good as the data feeding it, and that's a solvable problem, one that depends on building forecasts from question banks that actually match the real exam and from tools designed to build understanding.
Using topic accuracy forecasts as a study planning tool, not just a readiness check
None of this matters much if a forecast just sits there as a number to check once and forget. The real value of a topic-accuracy forecast is in what it tells a student to do next, and the adaptive structure of the test gives a clear order of operations for that.
The highest priority is any cluster sitting just below the Module 1 routing threshold, because closing that gap doesn't just nudge a score up a few points within a module. It can change which module a student receives entirely, which is a bigger lever than almost anything else available in prep. Right behind that comes any cluster where accuracy is inconsistent at medium difficulty, since those are exactly the kinds of questions Module 1 will serve, and inconsistency there creates real routing risk even when a student's overall numbers look decent. Clusters that are already strong, or clusters so weak they're unlikely to improve meaningfully before test day, matter less for forecasting purposes because they don't move the routing needle the way the first two categories do.
Study planning built around the Digital SAT increasingly reflects this logic, organizing prep around the test's actual routing mechanics instead of trying to cover every content area evenly. That's a real shift from how prep used to work, and it matters because broad, even coverage isn't actually what the adaptive format rewards.
Drilling more problems and filling the right gaps produce sharply different results here. A student who practices widely but never closes the two or three clusters gating their routing will plateau, no matter how many hours go into practice overall. A student working from an accurate topic-accuracy forecast, with a study plan built around those specific gaps, can move their routing probability even with limited time left before the test. One diagnostic approach built on this exact principle focuses on identifying where a student's understanding actually breaks down by topic, rather than simply counting wrong answers, so that the study plan built from it targets the gaps with the most leverage over the student's routing outcome. That's the real use of a topic-accuracy forecast: not a verdict to check once, but a map that updates as a student closes gaps, showing which move matters most right now.