Practice Test Length and Score Prediction Accuracy
Replicating the Digital SAT's adaptive logic is what separates predictive from fictional scores.
A practice test's score prediction is only as good as its ability to copy the real exam's structure, timing, and (for the Digital SAT) its adaptive logic. Get those three things wrong, and the score at the end of the test is basically a guess wearing a lab coat. Get them right, and a student walks into test day with a number worth trusting. This is the whole game: not "how many practice tests did you take" but "how faithfully did those tests behave like the real thing."
Some numbers to ground this. The Digital SAT runs 2 hours and 14 minutes, 98 questions total, split between 54 Reading and Writing questions (two modules, 27 questions each, 32 and 35 minutes) and a Math section built the same way. AP Exams work differently: two weighted components, multiple choice and free response, with the free-response side hand-scored by more than 30,000 educators each year during the AP Reading. And 2025 was the first year AP exams went digital at scale through Bluebook, with a substantial number of subjects fully digital or in hybrid format, and roughly 3.8 million digital AP exams administered. More than 90% of surveyed students said Bluebook was easy to use. Format familiarity is now part of the test itself. It's part of the test.
How the adaptive engine makes format replication the non-negotiable variable
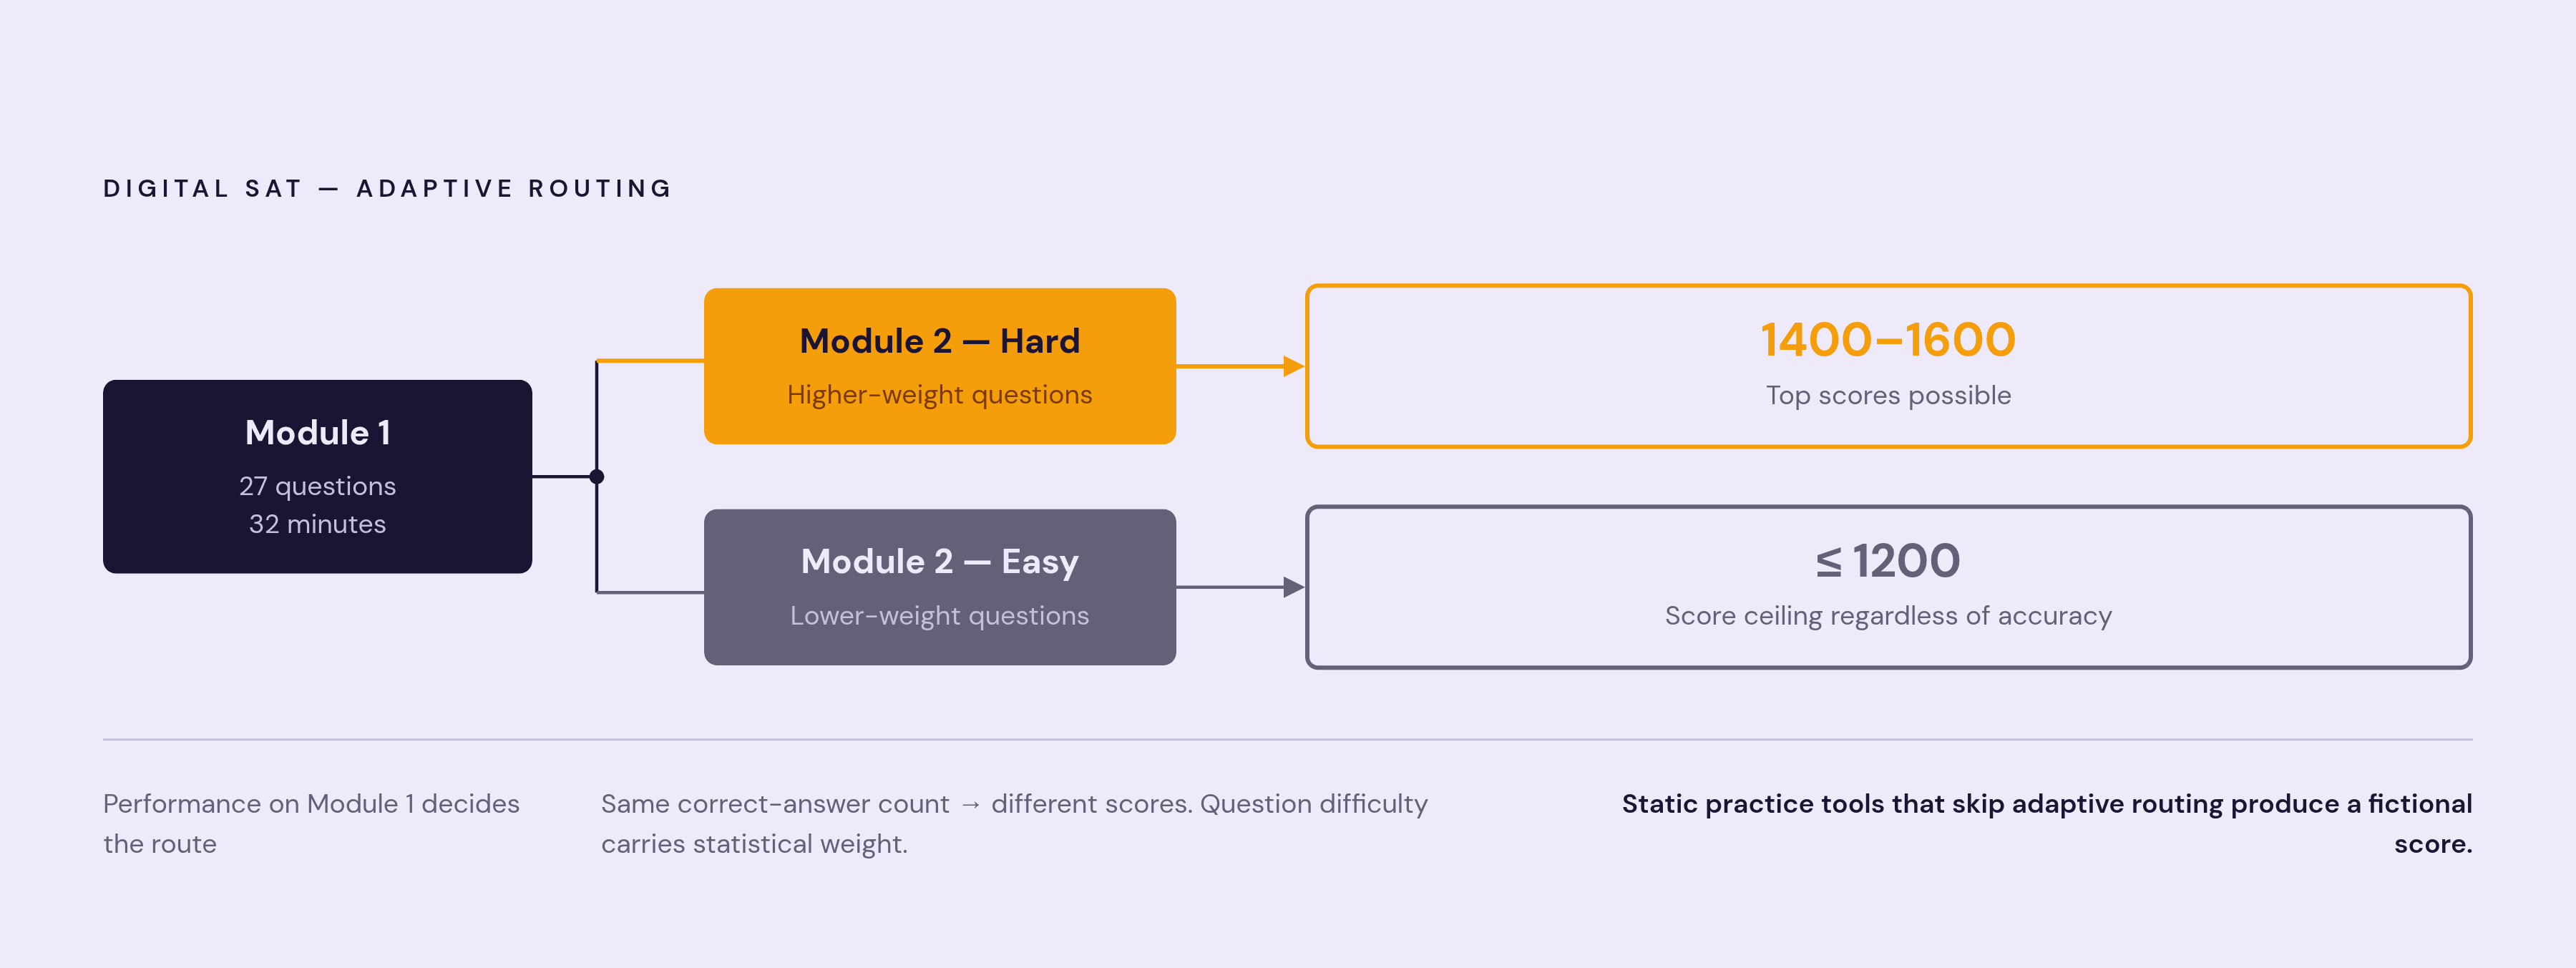
Start with the Digital SAT's core trick: it adapts. Module 1 performance decides whether a student sees a harder or easier Module 2. Answer well early, and the harder Module 2 unlocks, which is the only route to a top score. Struggle in Module 1, and the easier Module 2 shows up instead, capping how high the final score can go no matter how well the second half goes.
Sit with that for a second. Two students can answer the same number of questions correctly overall and land on different scores, because the difficulty and statistical weight of their questions were never the same to begin with. Two students can answer the same number of questions correctly overall and land on different scores, because the difficulty and statistical weight of their questions were never the same to begin with, and that's the test. That's the test, because the difficulty and statistical weight of their questions were never the same to begin with.
Now ask the obvious follow-up: can a static worksheet, or a percentage calculator that just averages "questions right," reproduce that branching? A static worksheet or a percentage calculator that just averages "questions right" cannot reproduce that branching. There's no routing logic in a spreadsheet. A tool has to actually simulate Module 1 performance and then serve up the correct Module 2 difficulty, calibrated the same way the real exam calibrates it, or the score at the end is fiction dressed up as feedback.
That calibration point deserves its own beat. The real Hard Module 2 is calibrated against years of actual student performance data, refreshed as new data comes in. Older or unofficial versions of a "hard module" are calibrated against older data, or approximated without that data at all. That gap explains why some practice tools consistently hand out inflated scores. Third-party providers that reverse-engineer the adaptive algorithm, without access to the proprietary model behind it, land all over the map. Some come reasonably close. Others miss by a wide margin, with reported gaps against a student's real score ranging from roughly 30 to 80 points, and in some cases considerably more. A gap of roughly 30 to 80 points, and in some cases considerably more, is not a rounding error. That's the difference between "safety school" and "reach school" on a college list.
What fatigue and test conditions measure, and why short tests hide them
Here's a variable that has nothing to do with content knowledge: stamina. The Digital SAT is nearly two and a half hours of sustained focus. Plenty of students see their performance sag in the later sections because concentration is a finite resource and they're running on fumes by the final Math module.
Fatigue appears only when a student actually sits through the whole test in one sitting, under real conditions. A test taken with the phone nearby, snacks on the desk, breaks whenever, and no real timer measures something adjacent to test day, not test day itself. It's measuring something adjacent to it, and adjacent isn't the same as accurate. That's arguably the single biggest methodology mistake in self-directed prep: treating a full-length practice test like a casual quiz instead of a dress rehearsal.
And fatigue doesn't just make people slower. It changes behavior. Tired test-takers guess differently, allocate time differently, and get more reluctant to even attempt the hard questions near the end, since attempting them feels expensive when the tank is empty. A test that ends early, or gets paused and resumed, never lets those vulnerabilities surface. Which means the score at the end looks cleaner than the student's real test-day performance is going to be.
That's a big part of why most students score somewhere between 20 and 50 points lower on the real SAT than on their practice tests. Not because the real test is secretly harder. Because practice conditions, more often than people admit, are quietly easier. The size of that gap depends on which practice test was used, how strictly it was taken, and factors like test anxiety, which raise their effect only when something is actually on the line.
Which official Bluebook tests predict most accurately
The Bluebook app offers multiple full-length practice tests, free and adaptive, all running on the same interface as the real exam. That adaptive routing is the reason Bluebook is the most trustworthy predictor available: it's the only practice option actually built on the same branching logic described above.
But "official" doesn't mean "identical difficulty across the board." In coaching contexts, the same student, in the same week, under identical conditions, can score roughly 100 points higher on Test 4 than on Test 11. Same brain, same week, wildly different number. That's a calibration difference between tests, not a reflection of the student suddenly getting worse at reading comprehension on a Tuesday.
Breaking down the eight tests roughly into tiers helps make sense of this:
Tier 1, closest to current real-exam difficulty: Test 11, released in early 2026, was built specifically to close the gap between practice scores and real scores. Its Reading and Writing passages come from actual past SAT administrations, and its scoring curve is calibrated against real test data. Students taking it under realistic conditions tend to land close to their eventual real SAT score, which makes it a strong test to take close to the exam date. Test 7 was built entirely from new questions in 2025, with no recycled material from the retired Tests 1 through 3. It runs with harder vocabulary and its scoring lines up well against recent real administrations, making it the second most reliable predictor of the eight.
Tier 2, solid mid-prep tools with known quirks: Tests 5 and 6, released in 2024, were the first real attempt to bring practice difficulty in line with the actual exam. Test 5 tends to run a bit more accurate; Test 6 runs slightly harder than a typical real SAT. Test 10, part of the 2025 batch alongside Tests 8 and 9, is the most balanced of that group, with reasonable Math difficulty and reliable results once the foundational skills are actually in place.
None of this means the other tests are useless. It means the timing of when a student takes which test should be intentional, not random. Save the most accurately calibrated tests for closer to the real exam date, when the prediction actually needs to count.
Why the number of practice tests taken matters less than how they are used
It's tempting to treat "more practice tests" as automatically better. It isn't, and the research on practice effects backs that up. Across cognitive testing generally, the bulk of improvement occurs in the first several sessions, and gains flatten out hard after that, sometimes to nearly nothing. Quantity has diminishing returns. Quality doesn't.
For the SAT specifically, most students see the fastest gains from something like 3 to 6 full practice tests, spaced out across a study timeline, each one used to build pacing, confidence, and comfort with the adaptive format. But that value occurs only if each test gets reviewed in depth afterward. A full test taken and immediately forgotten is basically a very long, very expensive nap for the brain.
Score accuracy on Bluebook itself tends to degrade after a student has taken roughly 3 to 4 of the eight tests, simply because the question pool starts feeling familiar. That's a different problem than the calibration issue discussed earlier. Calibration is about whether the test measures the right difficulty. Familiarity inflation is about the student starting to recognize patterns from repeated exposure, which quietly puffs up the score without reflecting a real gain in ability.
A large 2025 observational study, tracking a substantial number of test-takers on a digital adaptive English proficiency test, found that taking one to three practice tests correlated with higher scores and better feelings about the process, while taking more beyond that showed diminishing returns. The researchers floated an explanation called washback, where students start using the "test" as a study tool rather than a measurement tool, which muddies what the resulting score is even supposed to represent. One might read that finding and ask: is more practice actually helping, or is it just changing what's being measured?
How to build a trustworthy score range rather than chasing a single prediction
Chasing one perfect number is probably the wrong goal here. A score range, built from a handful of well-run practice tests, tells a more honest story than any single test ever could.
Getting a usable range means holding conditions constant: a realistic full-length adaptive test, done in one sitting, timed strictly, in a quiet room, with only the tools actually allowed on test day. Without that consistency, comparing one score to the next is like comparing a sprint time run downhill to one run uphill.
Once a few of those clean attempts exist, look at the pattern rather than the peak. If three recent scores cluster close together, that cluster is the real signal, and it's more trustworthy than whichever one happened to be the highest. If the scores swing wide instead, that swing is itself the finding. It usually points to something specific: inconsistent pacing, shaky fundamentals that come and go depending on the question mix, fatigue, or test conditions that weren't actually held constant between attempts.
The same logic applies to AP prep, adjusted for the exam's structure. Tools that apply the published weighting (50% multiple choice, 50% free response) along with composite-to-score thresholds pulled from released exams tend to land within about one AP score point of accuracy, but only when both halves of the exam get practiced and scored honestly. Skip the free-response half, or grade it generously, and the resulting prediction is only telling half the story.
There's also a human factor: students' own predictions about their performance affect how they prepare and how accurately they gauge readiness. Research on AP student self-prediction has found that students' own guesses about their scores were positively linked to actual performance, in both low- and high-stakes settings. But self-assessment accuracy was not uniform across all students, suggesting that the environment a student is learning in shapes how accurately they read their own readiness. Self-assessment has some value. It's just not evenly reliable, which is exactly the argument for pairing it with external, standardized calibration rather than relying on gut feeling alone.
Using practice test results to find and close the knowledge gaps that score predictions obscure
Here's where the single score number starts to actively mislead. A student can post the same total score on two different practice tests while making real cognitive progress that shifts from missing basic, foundational questions to missing harder, application-style questions instead, a shift produced by genuine skill development that the total score does not register. The total looks flat. The underlying skill picture is uneven, shifting from basic errors to harder, application-style ones even as the total stays flat. That's the case for looking at subscores and question types, not just the headline number.
What happens during review matters just as much as the test itself. Research on study methods shows a real gap between active recall and passive review: students using active recall retained 57% of material compared to 29% for passive rereading, and active recall techniques improved test scores by up to 20% in some studies. In plain terms: skimming back over a missed question and nodding along isn't the same as actually retrieving the concept from memory and rebuilding it. One is close to studying. The other is closer to watching studying happen.
There's also evidence that consistent, structured self-testing beats occasional full-test marathons. One analysis found that students who completed all available self-testing opportunities scored 11% higher on final course performance than those who skipped self-testing entirely, with roughly a 1.1% bump in final scores for every 10% increase in practice question completion. That's a fairly strong argument for working through practice questions steadily throughout prep, rather than saving everything for a handful of big test days.
The technical backbone behind a lot of modern gap-detection tools is something called knowledge tracing: modeling what a student does and doesn't know as they answer questions, first formalized by Corbett and Anderson and later extended by Piech and colleagues in their work on deep knowledge tracing. Modern adaptive exam prep platforms build on that foundation to route students toward their specific weak spots in real time, rather than just handing back a score and calling it a day.
Which loops back to the opening point. A score is a snapshot. A well-built range, taken from carefully run tests, reviewed with real rigor, tells a fuller story than any single number can. The length of a practice test, and how honestly it copies the real exam's format, timing, and adaptive structure, is what decides whether that story is worth believing.